


And HomeSings me of sweet thingsMy life there has it’s own wingsTo fly over the mountainsThough I’m standing still—Karla Bonoff
Applying national statistics to local markets is always problematic. While
local markets are informed by national and world markets, they are driven by
local conditions. You can always find local exceptions to national trends. For
example, Texas weathered the 2008 downturn much better than other parts of the
US (and some parts even boomed) because of the Eagle Ford Shale oil boom.
Similarly, parts of Texas were desperate during the national boom of the 90s
because the farm economy was down.
That said, I’m going to show you three graphs of US census data that,
according to economic blogger Barry Ritholtz, “tell the tale of the US housing
market.”
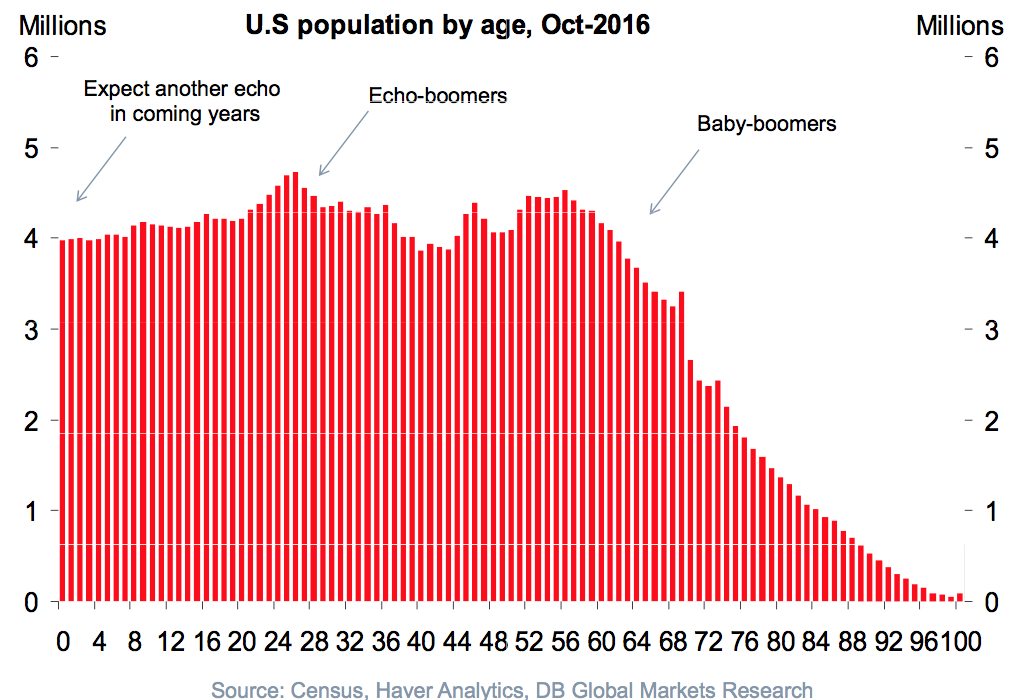
The top chart shows the current population of the US by age. Surprisingly,
26-year-old are the largest single age group while Baby Boomers like me are
starting to die off (but we are apparently still a large enough block to cause
problems for a well-raided Social Security fund). Now, most people who buy a
house buy their first one sometime between 25 and 30. So this age group should
be putting a lot of pressure on the housing market.
But home ownership is still trending down (see the middle chart). Why is that?
Part of the reason is that the largest population segments—the one that would
normally be powering the housing economy—are staying at home. Almost ⅓ of
still lived with their parents as of 2013 (bottom chart).
I don’t want to get into a discussion of why they still live at home. Frankly,
I don’t know. But it is important to understand that they do for a couple of
reasons.
- Banks take this information into account in making lending decisions. Just look at the source of the graphics: Deutsche Bank’s Chief International Economist Torsten Slok.
- It speaks to the way the national economy is evolving.
Conclusions
At the risk of falling victim to confirmation bias, this data supports one of
my beliefs about the way our housing economy is evolving: Home ownership is
concentrating in the hands of fewer people, namely investors or landlords.
This concentration has several consequences for investors and homeowners
alike.
- This trend will continue and we will see more renters and people living in extended family units. Rents will go up, and more families will be concentrated into denser housing like apartments.
- As the percentage of renters increases, wealth will become more concentrate in the hands of fewer people.
- This concentration of real estate wealth will be self-reinforcing.
- It will become more difficult for young people to save enough to buy their first home.
- Investors wanting to sell single-family homes will face a shrinking market comprised primarily of other investors whose main interest will be to buy as cheaply as possible in an expensive market.

No comments:
Post a Comment